|
1 members (Alisa),
1,680
guests, and
23
robots. |
|
Key:
Admin,
Global Mod,
Mod
|
|
S |
M |
T |
W |
T |
F |
S |
|
|
|
|
|
1
|
2
|
3
|
|
4
|
5
|
6
|
7
|
8
|
9
|
10
|
|
11
|
12
|
13
|
14
|
15
|
16
|
17
|
|
18
|
19
|
20
|
21
|
22
|
23
|
24
|
|
25
|
26
|
27
|
28
|
29
|
30
|
31
|
|
There are no members with birthdays on this day. |
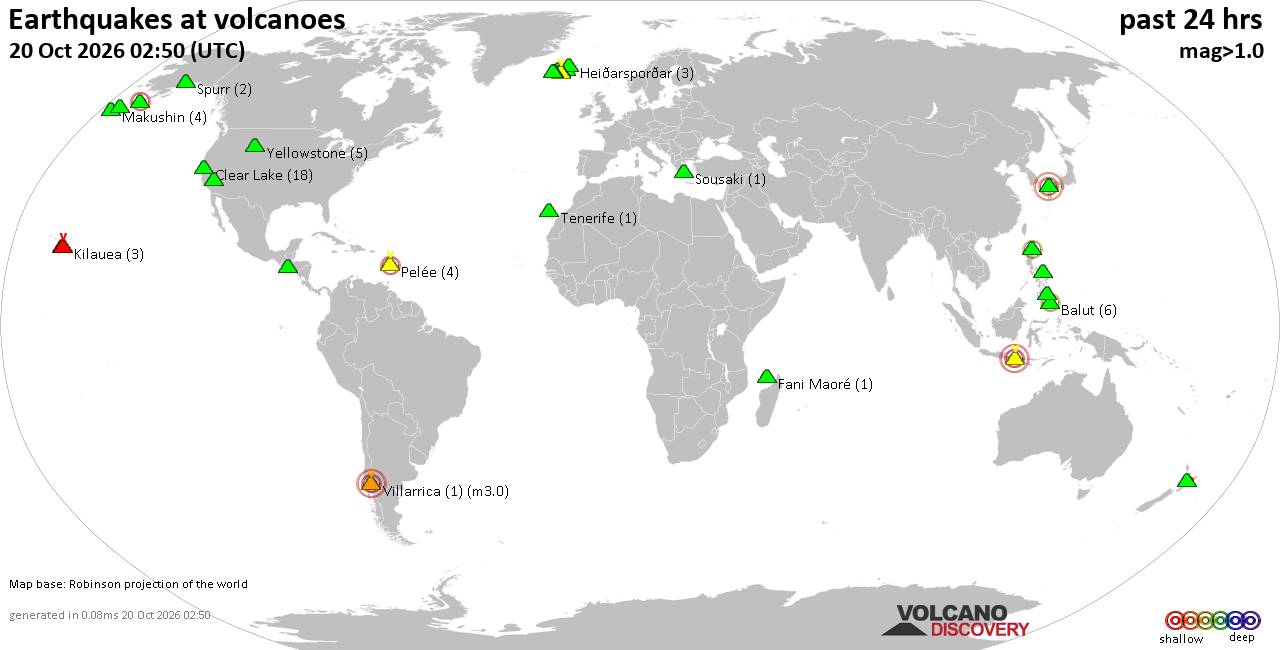
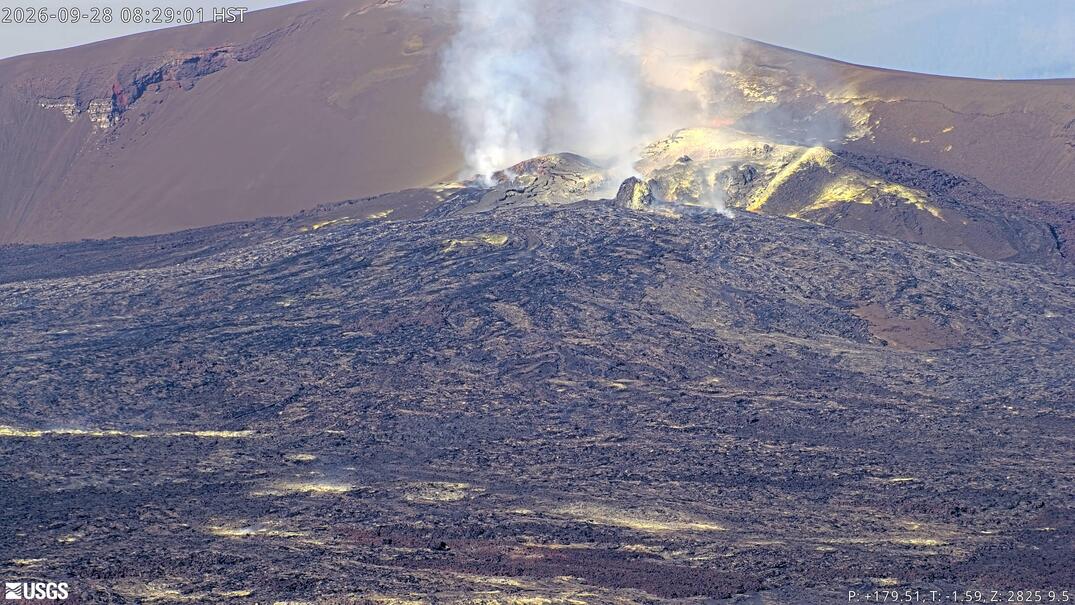
Volcano earthquake report for Tuesday, 20 October 2026
• M 7.7 - 12 km WSW of Pitaloza Arriba, Panama
• M 1.1 - 7 km SSW of Olancha, CA
• M 5.6 - 43 km NNW of Lake Minchumina, Alaska
• M 0.2 - 11 km WNW of Cobb, CA
• M 2.2 - 15 km NNE of Milford, Utah
|

#4659
Sun 11 May 2003 11:13:AM
|
Joined: Feb 2001
Posts: 3,536
Mission Commander
|
|
Mission Commander
Joined: Feb 2001
Posts: 3,536 |
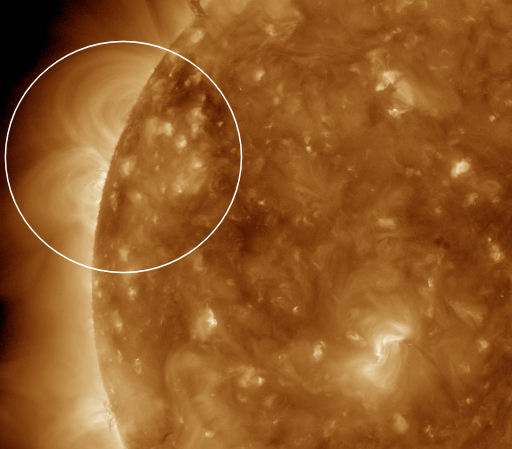
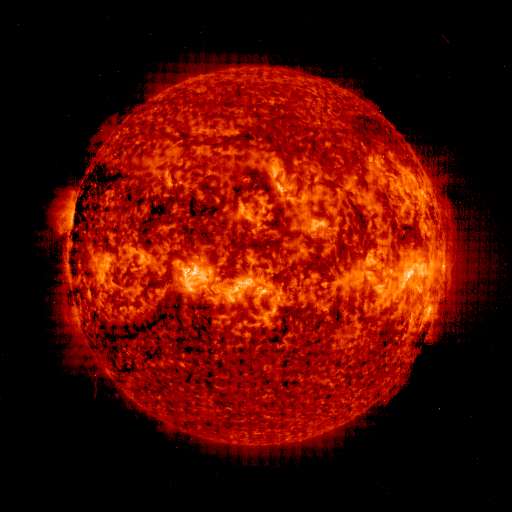
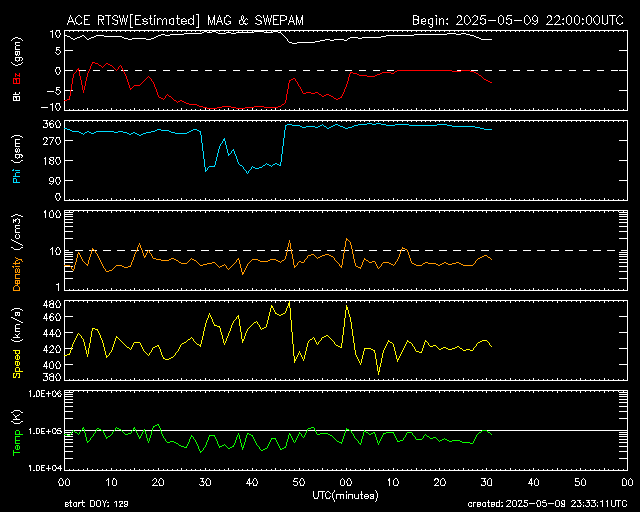
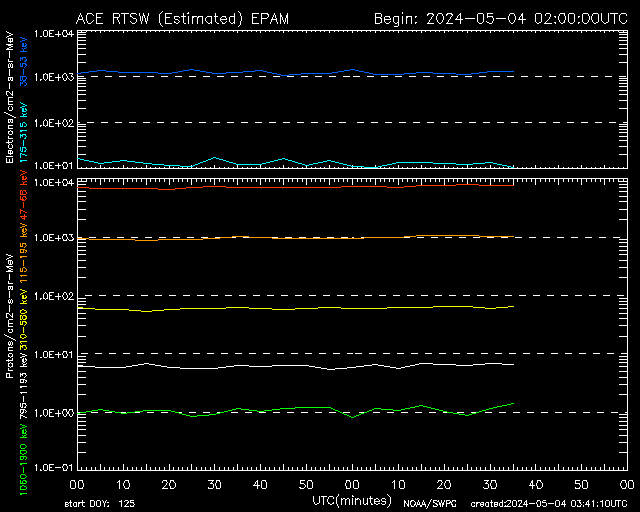
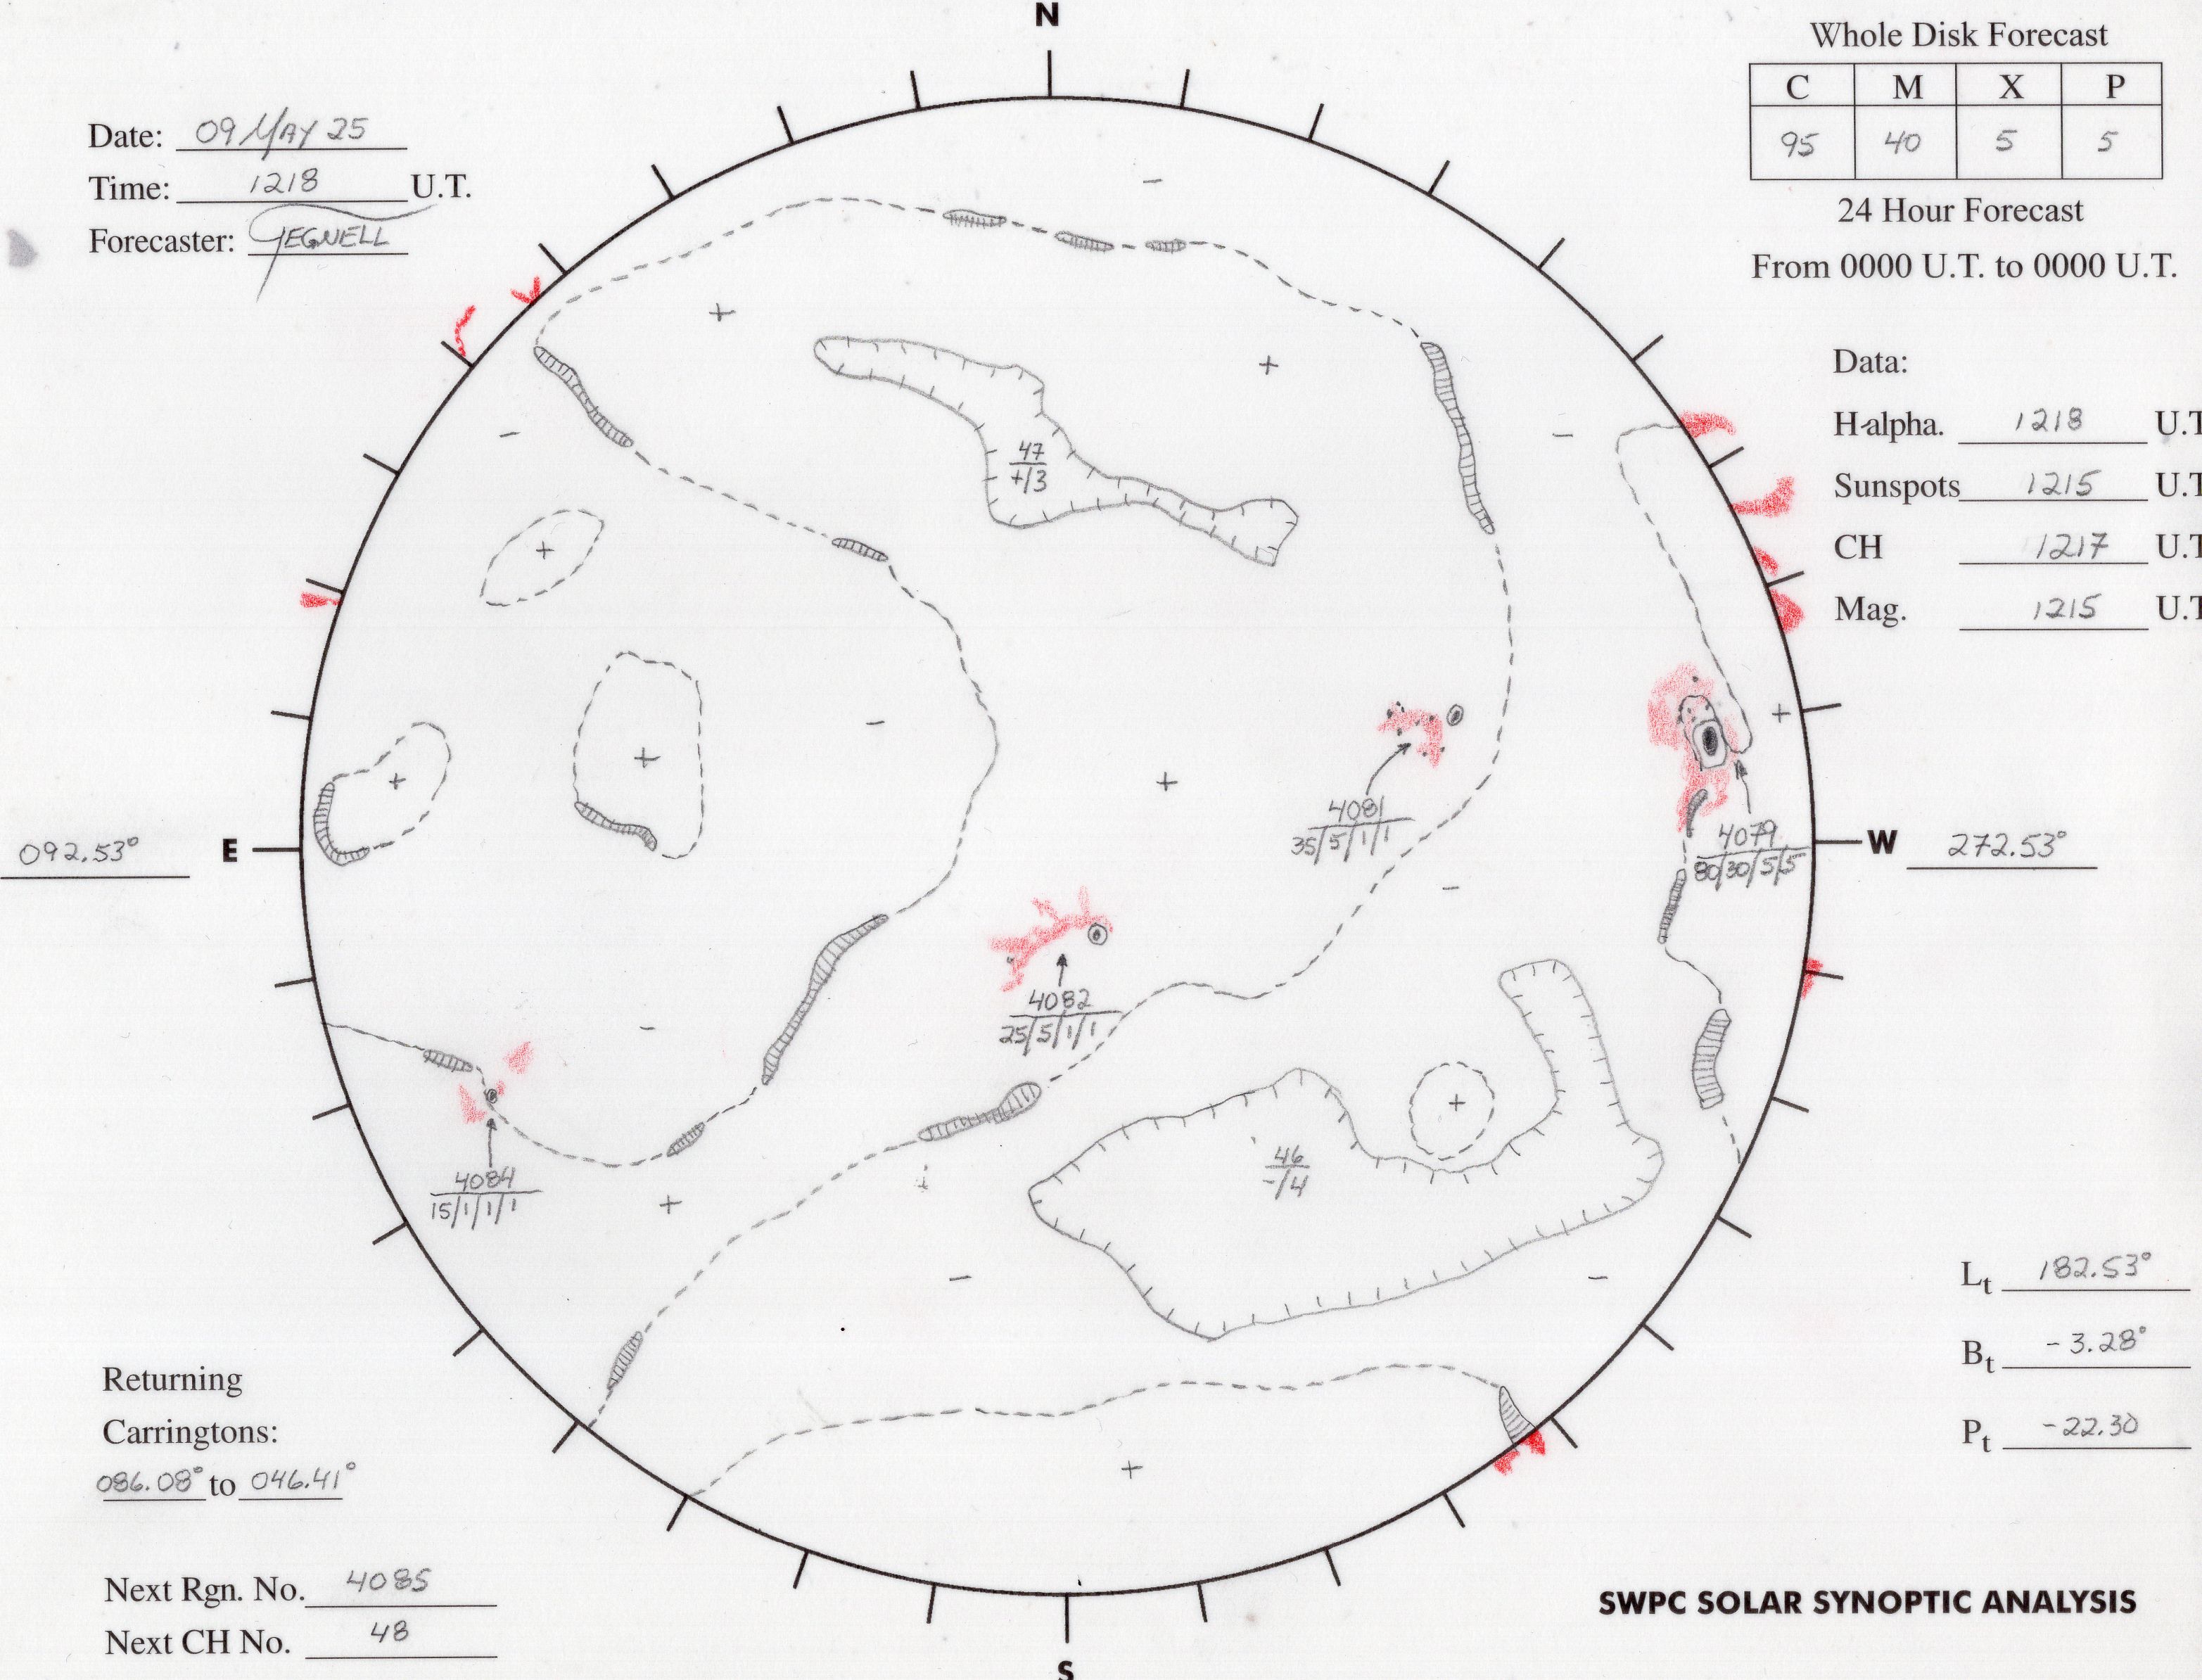
SB PROP @ ARL $ARLP019<br />ARLP019 Propagation de K7RA<br /><br />ZCZC AP19<br />QST de W1AW <br />Propagation Forecast Bulletin 19 ARLP019<br />>From Tad Cook, K7RA<br />Seattle, WA May 9, 2003<br />To all radio amateurs <br /><br />SB PROP ARL ARLP019<br />ARLP019 Propagation de K7RA<br /><br />The weeks of active geomagnetic conditions continue and seem to<br />stretch into months. This week was no exception. The average<br />planetary A index was 20.7, and the week before was 23.7. One day<br />was quiet, May 4, when the planetary A index was only 7. The worst<br />days this week were May 1 when the A index was 40 and May 7 when it<br />was 36.<br /><br />These were the worst days for HF operators, but probably not if you<br />like 6-meters. John Reynolds, N7QF reported from Utah that on May 1<br />he had a good sporadic-E opening into Oklahoma and Texas. He didn't<br />say, but I assume this was on 6-meters. The distance was about 850<br />miles, and he said most of the people he worked were using 100 watts<br />and a 3 element Yagi.<br /><br />April 30, the day prior, had Jon Jones, N0JK working Argentina on<br />6-meters from Kansas with E and F2 layer propagation. He says he<br />also worked TI5KD with double-hop E-skip.<br /><br />Solar flux and sunspot numbers were down this week. Average sunspot<br />numbers were down nearly 40 points from the previous week and<br />average solar flux was down over 10 points. Solar flux and sunspot<br />numbers have been declining again. Solar flux will probably go below<br />100 over the weekend. Solar flux was below 100 only one day in the<br />past month on April 17, but it dipped just one point below to 99.<br /><br />Predicted solar flux for Friday, May 9 to Monday, May 12 is 95, 95,<br />100 and 100. The latest forecast shows the planetary A index not<br />going below 20 until May 16. The earth is currently inside a solar<br />wind stream, as it often has been for past months. An interplanetary<br />shock wave, probably from a coronal mass hit earth at 0500z today,<br />May 9, and should keep conditions active.<br /><br />Nearly ten years ago Scott Craig, WA4TTK released a freeware program<br />for plotting the solar numbers from this bulletin. He calls it the<br />Solar Data Plotting Utility, and it has been improved over the<br />years. The current version runs in Windows and can automatically<br />retrieve data, either from this bulletin, or via FTP from the ARRL.<br />Scott has just posted a new updated data file that has daily solar<br />flux and sunspot numbers from January 1, 1989 through April 30,<br />2003. You can download Scott's software from<br /> http://www.craigcentral.com .<br /><br />Another great resource is the NOAA Space Environment Center's<br />Preliminary Report and forecast, which comes out weekly. It used to<br />be published on paper and mailed, but you can look at it in PDF form<br />at the SEC NOAA we site at,<br /> http://www.sec.noaa.gov/weekly/index.html .<br /><br />The current issue, published May 6, has some tables showing<br />predicted solar flux and sunspot numbers until the end of 2007, and<br />smoothed numbers back to January 1998. It looks like currently we<br />have solar activity around the same level as it was about 5 years<br />ago. Of course a big difference is that back then the solar activity<br />was increasing, and now it is on the decline. The chart seems to<br />suggest that in 14 months the sunspot count will be about half what<br />it is now, and it drops to one fourth about 2 years and one month<br />from now.<br /><br />For more information on propagation and an explanation of the<br />numbers used in this bulletin see the Propagation page on the ARRL<br />Web site at http://www.arrl.org/tis/info/propagation.html .<br /><br />Sunspot numbers for May 1 through 7 were 171, 175, 134, 172, 144,<br />117, and 109, with a mean of 146. 10.7 cm flux was 148.7, 156.5,<br />147.7, 142, 128.8, 122, and 110.2 with a mean of 136.6. Estimated<br />planetary A indices were 40, 17, 10, 7, 12, 23, and 36, with a mean<br />of 20.7.<br />NNNN<br />/EX
|
|



CMS The Best Conveyancing solicitors conveyancing quotes throughout the UK
For any webhosting enquiries please email webmaster@aus-city.com
|
|
Entire Thread
|
 ARLP019 Propagation de K7RA
|
VA3DBJ
|
Sun 11 May 2003 11:13:AM
|
|
Forums60
Topics885,066
Posts919,863
Members2,960
| |
Most Online102,106
Jul 10th, 2026
|
|
|